Mask R-CNN on 143 validation images (8,541 kernels).


Faculty of Mechanical Engineering & Technology, UniMAP
Machine vision classification of rice milling fractions
Mask R-CNN on 143 validation images (8,541 kernels).
Faculty of Mechanical Engineering & Technology, UniMAP
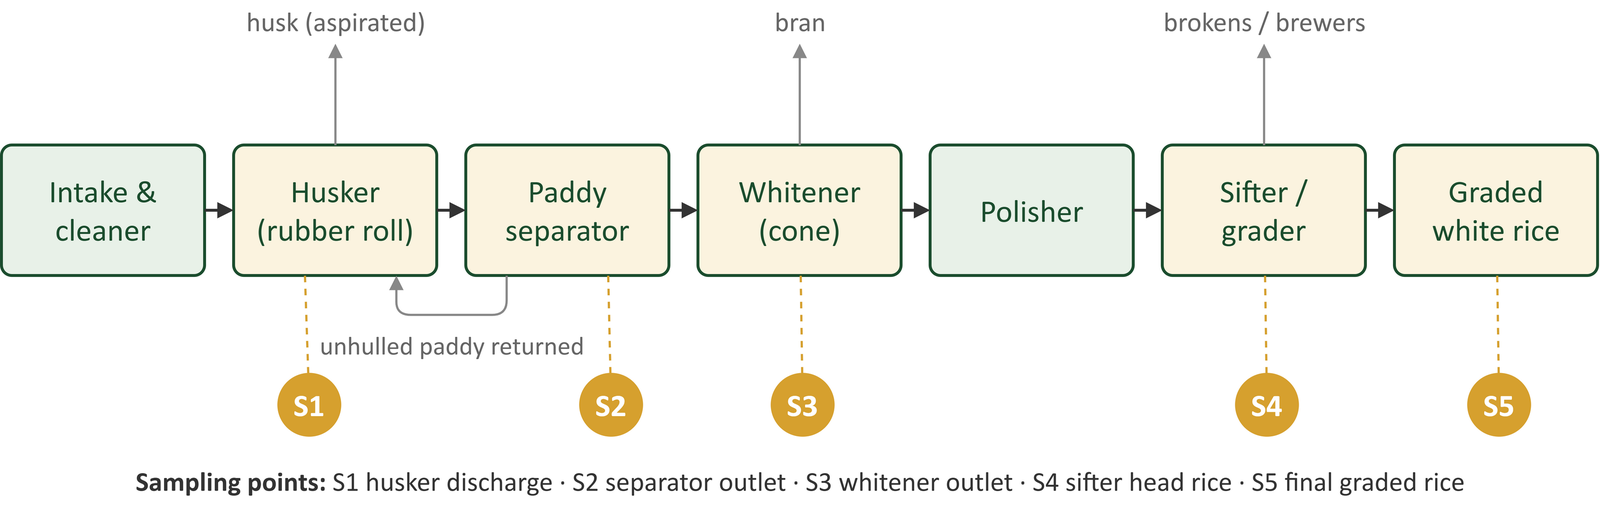
Mills check their huller and whitener performance with an in-plant milling test. A sample is sorted by hand into paddy, husk, brown rice, head rice and broken rice, and each fraction is weighed.
Manual sorting is slow, so machine settings are corrected late.
Whether a kernel counts as whole or broken is decided by eye.
The test gives totals only, with no length profile of broken kernels.
Malaysia's rice self-sufficiency level fell from 68% to 56% between 2018 and 2023 (MyCC, 2024).
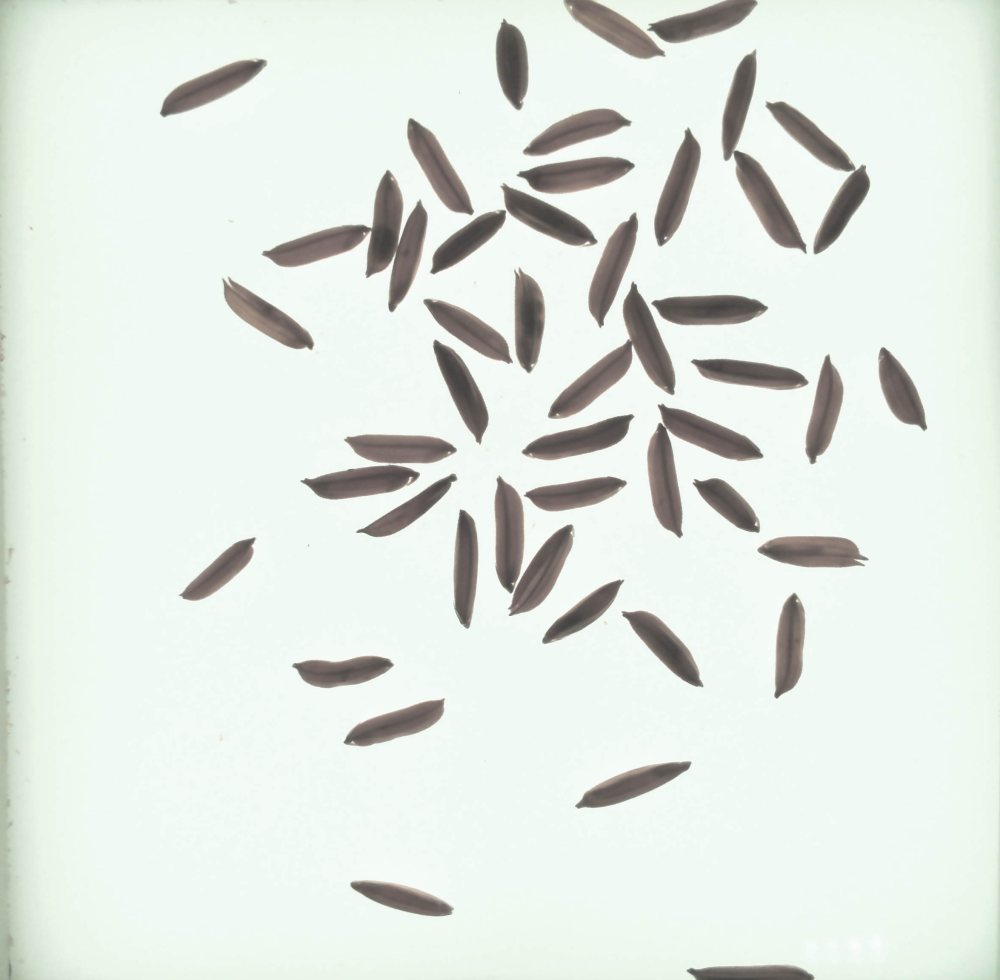
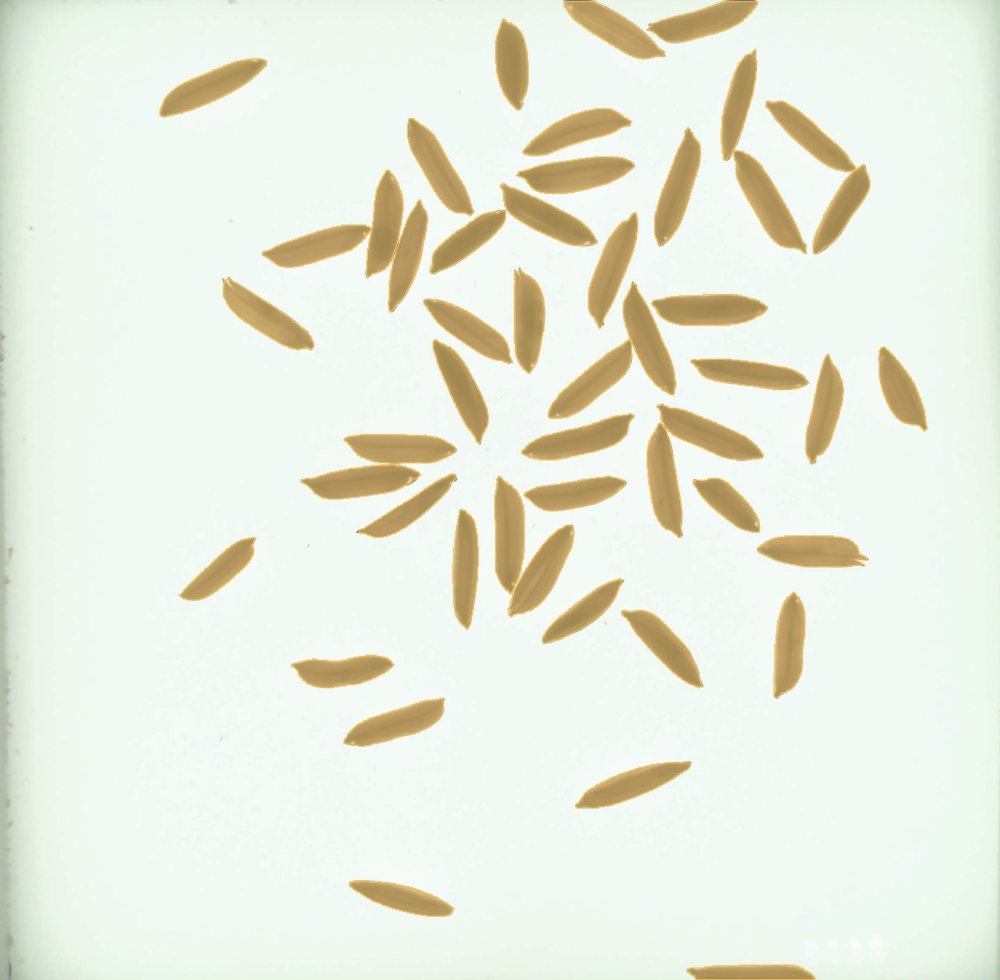 Raw imageMask R-CNN masks
Drag the slider. A validation tray the model never trained on: all 49 labelled paddy grains found and classed correctly, with no false detections (Mask R-CNN, confidence 0.50).
Grading runs on the device itself; a phone browser is the screen. Rotate it in 3D ↑
Real kernels from the device's own dataset, photographed on the backlight exactly as the model sees them.
Mask R-CNN is a two-stage instance segmentation network (He et al., 2017). It first proposes regions that may contain an object, then predicts a class, a bounding box and a pixel mask for each one. The per-pixel mask is what separates touching kernels and gives the length, width and area of each kernel.
Each image shows one pure, hand-sorted pile, so the class of every kernel is known without labelling each kernel by hand. Kernel outlines were generated automatically by classical segmentation.
Validation set: 143 images, 8,541 kernels.
| Metric | Value | Meaning |
|---|
By class
Mask mAP by class
| Class | mAP@0.5 | mAP@ 0.5:0.95 | Correct class |
|---|
Where it confuses classes
Confusion matrix (detected kernels)
Rows are the true class, columns the predicted class. Blue = correct, orange = mix-ups.
Validation mask mAP by epoch
Training loss
| Epoch | Train loss | mAP@0.5 | mAP@0.5:0.95 |
|---|---|---|---|
| 5 | 0.550 | 0.917 | 0.745 |
| 10 | 0.482 | 0.930 | 0.761 |
| 20 | 0.421 | 0.936 | 0.778 |
| 30 | 0.380 | 0.936 | 0.775 |
| 40 ← best | 0.355 | 0.938 | 0.779 |
| 50 | 0.348 | 0.939 | 0.773 |
| 60 | 0.344 | 0.939 | 0.770 |
The validation score levels off after about epoch 20. The training loss keeps falling, but validation mAP@0.5:0.95 does not improve after epoch 40, so the epoch-40 weights are the ones deployed.
Both models were trained on the same split and scored by the same script, against the same ground truth and at the same mask resolution.
| Metric (validation) | Mask R-CNN | YOLO26n-seg |
|---|---|---|
| Mask mAP@0.5 | 0.938 | 0.948 |
| Mask mAP@0.5:0.95 | 0.779 | 0.798 |
| Recall | 93.6% | 94.1% |
| Precision | 96.4% | 95.3% |
| Class accuracy | 98.7% | 100.0% |
| Count error per image | 2.53 | 2.87 |
| Time per image, laptop CPU | 6.34 s | 0.98 s |
| Time per image, Raspberry Pi 5 | tens of seconds* | about 1 s* |
| Model file size | 184 MB | 6.6 MB |
● marks the better value in each row.
Time per image, laptop CPU (seconds)
*Pi timings are from the project's comparison notes and were not measured with the benchmark script. Time a capture on the device before quoting a figure.
Spread, capture, and see every kernel outlined. Ask us for a demo.